

Rowan Analytics Insights
Patent Prosecution Analytics Benchmarking Report – January 2022
Does drafting and filing a high volume of patents lead to fewer 112 rejections? We investigated this in 2021, and will continue to do so in 2022. This month we expanded the work we started in December to look into law firms, concentrating on the top ten law firms in terms of grants by volume at the USPTO as identified by Harrity Patent Analytics.
In the Fall of 2021, we looked at the three most prolific filing companies by Technology Center (see our Benchmarking Reports for September, October, and November). This month we revisited those same Tech Centers and studied the 3 highest volume law firms. Do the companies and the law firms have similar results?
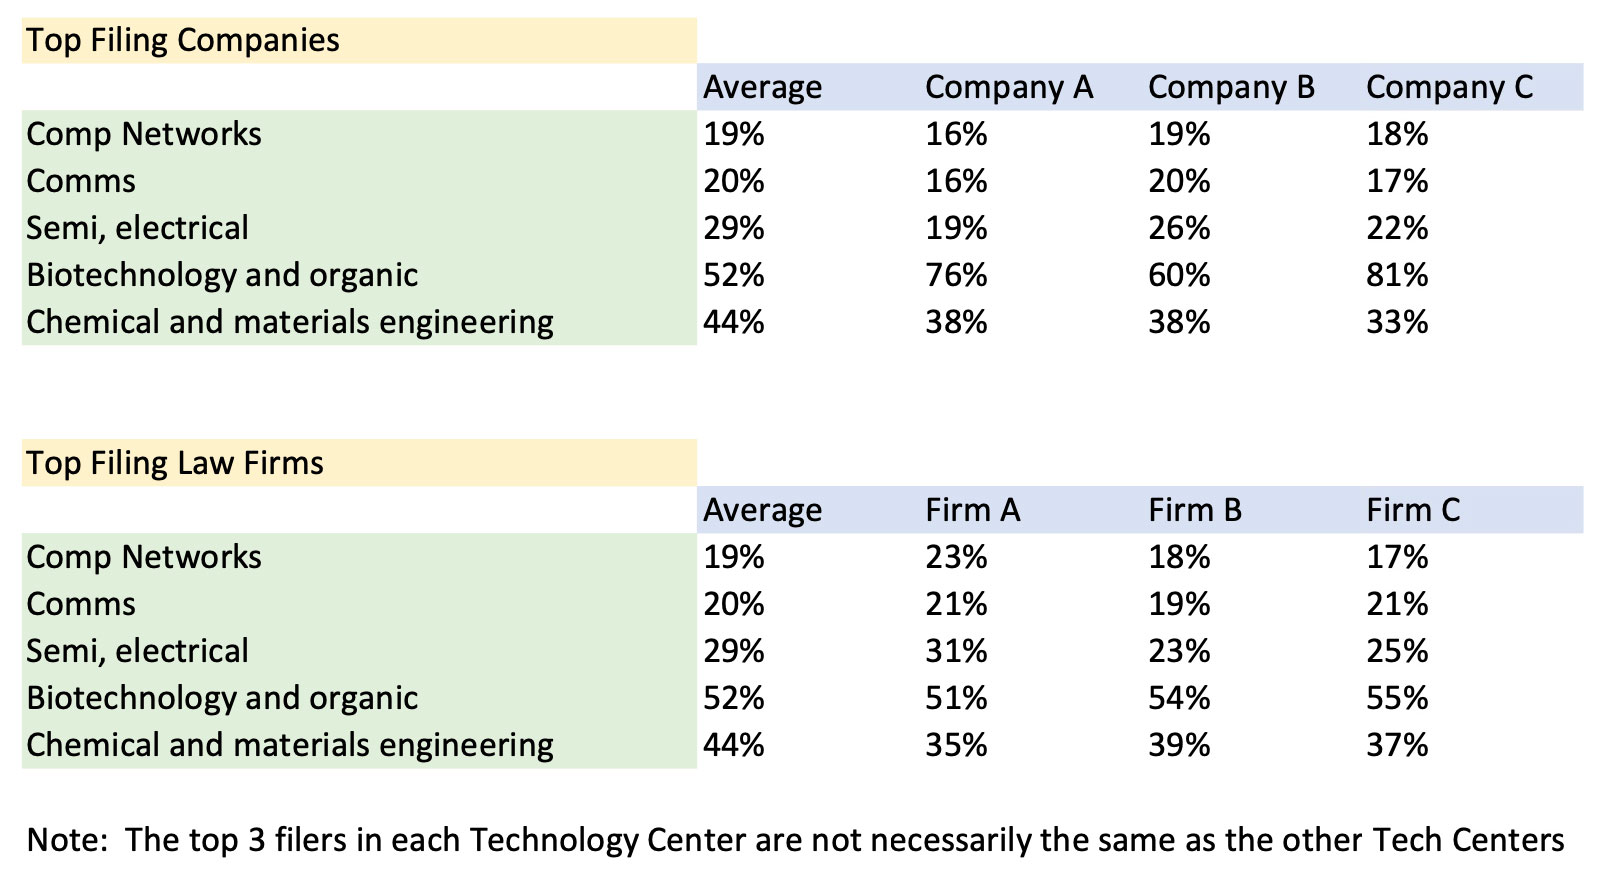
We started with the Tech Centers most frequently associated with high tech consumer electronics – computer networks (2400), communications (2600) and semiconductor / electrical (2800). Among the three top filing companies, each did at least as well or better than the USPTO national average when looking at 112 rejection rates. When looking at the top 3 filing firms, the picture is a bit different. In each Tech Center, we found that some firms did better than the national average, and some did worse. Interestingly, the firm with the highest volume of granted patents in these three Tech Centers combined has the highest percentage of 112 rejections among the top 3.

We then moved to Tech Center 1600, consisting of biotechnology and organic patents. Our October newsletter showed the top 3 filers all having higher 112 rejection rates than the national average. When we looked at the same data for the top filing firms, we see them all much closer to the national average.

The last Technology Center we investigated was 1700 – chemical and materials engineering fields. In this case, the top 3 filing companies all demonstrated 112 rejection rates lower than the national average. The top filing firms in 1700 showed similar results – all several percentage points below the national average.

In summary, while there are exceptions (most notably in the 1600 Technology Center), in many cases the most frequent filing companies and law firms had 112 rejection rates lower than the USPTO national average.
Note: Harrity Patent Analytics has released their top legal firms of 2021. In order to remain consistent with our past analysis, we have used their top legal firms of 2020 for this article. In a future edition we will examine differences between 2020 and 2021.
Request Custom Analytics
If you would like to receive data on applications filed by your firm or your company like the below, to help you understand the power of analytical data to help you, please contact us and we will be happy to analyze your applications as a courtesy.

Sources: USPTO, Rowan analysis
Book a No-Obligation Discovery Call
Rowan Patents is the only platform designed specifically for the drafting and prosecution of patent applications. We’d be happy to answer any questions and provide more resources or information—with no obligation.
