Rowan Analytics Insights
Patent Prosecution Analytics Benchmarking Report – September 2021
Analyzing 112 Rejections Received by Three Top Filers
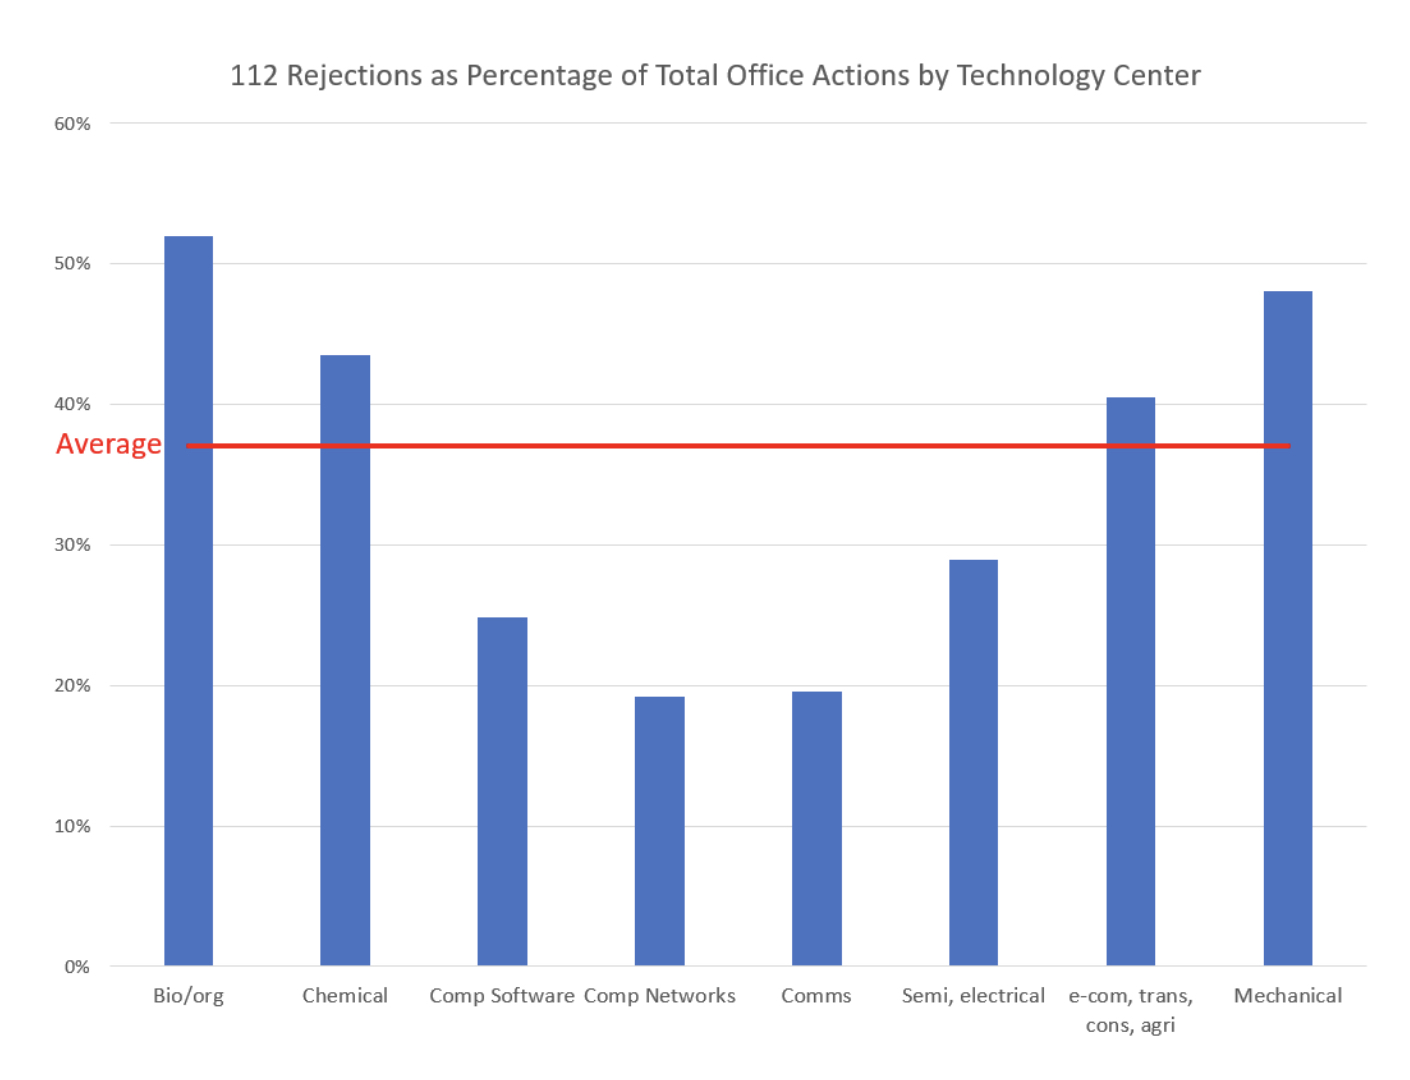
In August, we took a look at the percentage of 112 rejections compared to the total number of Office actions received by technology center. We found that the percentage of 112 rejections varied significantly by technology center.
This month, we thought it would be interesting to pick three of the most prolific filers, peer companies who primarily produce products in high tech consumer electronics, and look at their individual statistics. Would they all follow the same patterns or would we see variations? Each is among the top 20 patent filing companies in the US. While they tend to file most of their patents in three technology centers – computer networks (2400), communications (2600) and semiconductor / electrical (2800), each of them also files in other technology centers as well.
Similar to what we saw last month in the percentages of 112 rejections across technology centers, we see variations in the incidences of 112 rejections in certain technology centers for these three filers.
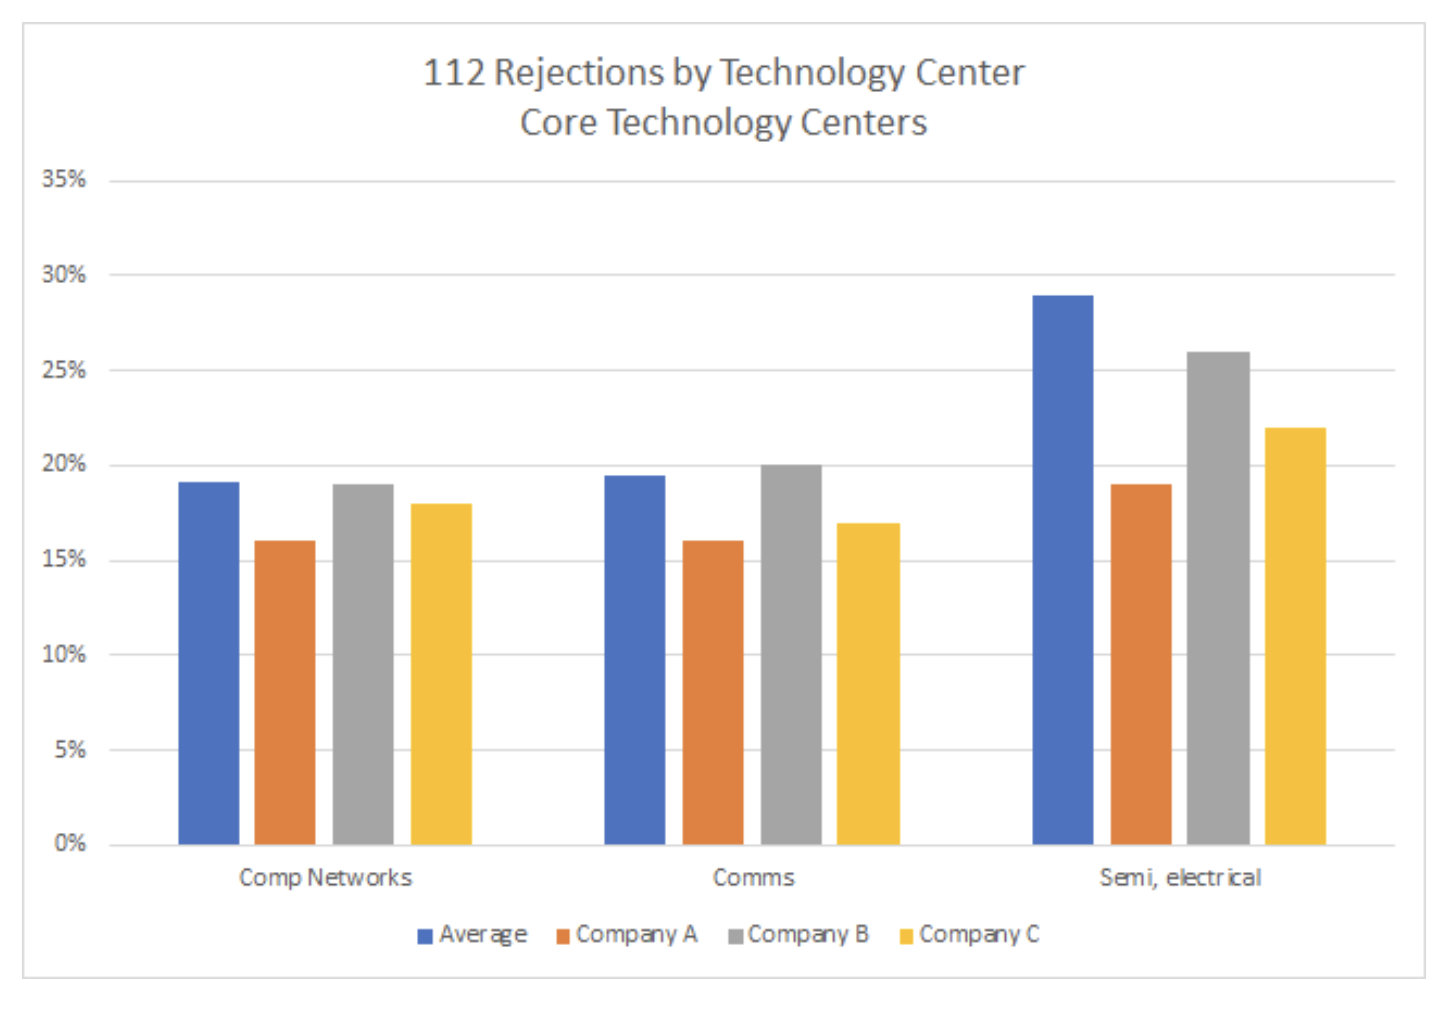
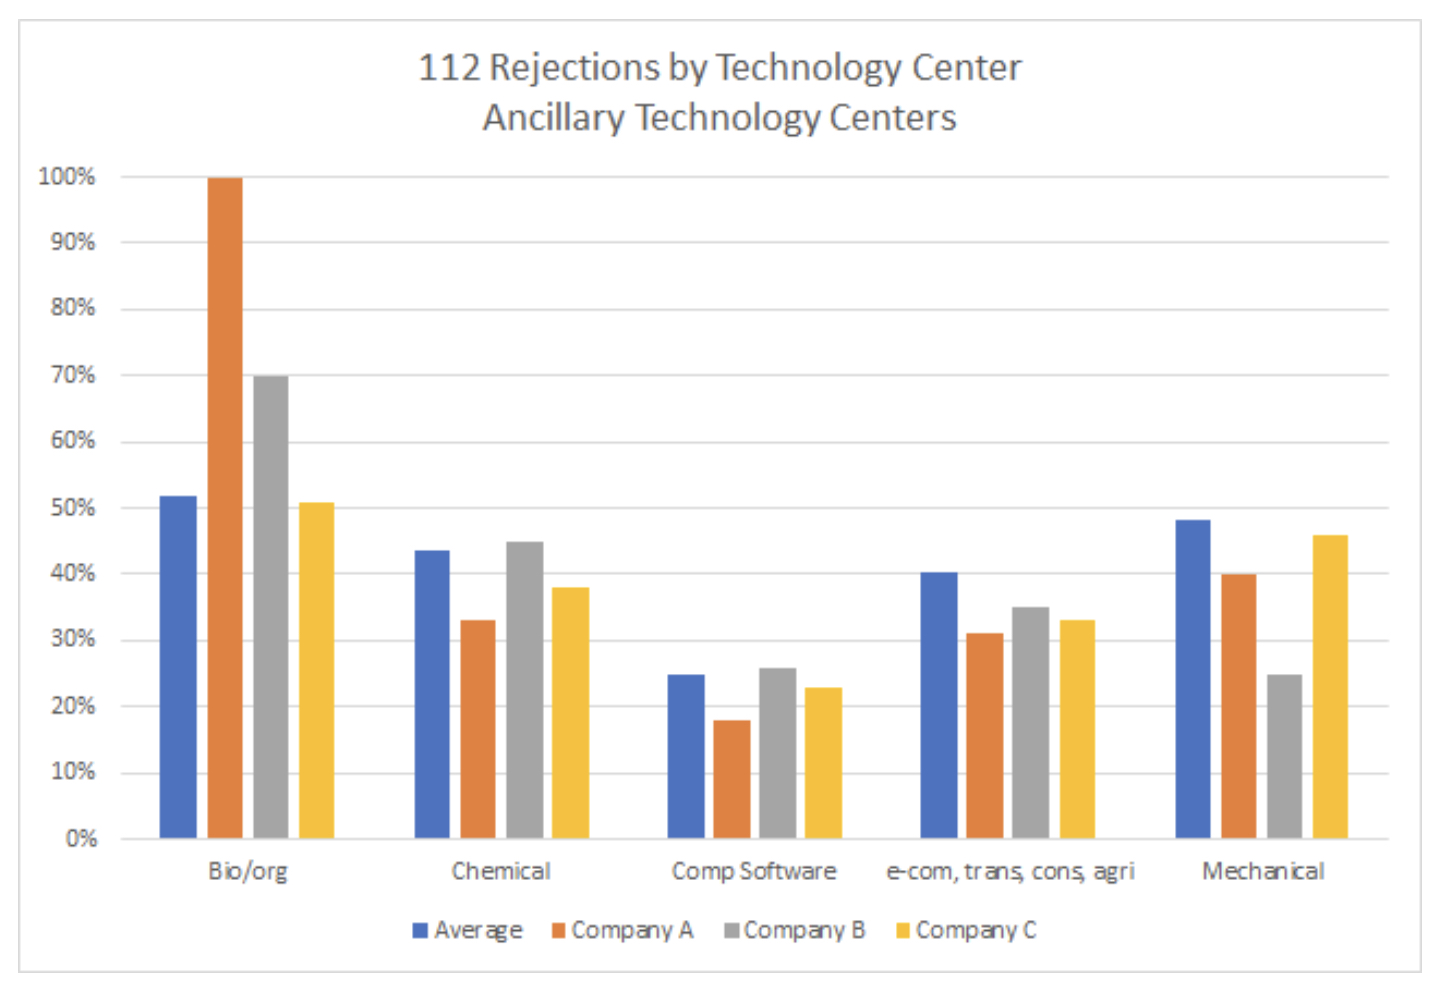
In the charts below, we looked at the percentage of 112 rejections by technology center split into two groups: the three centers where our three filers had the most activity – computer networks, communications and semiconductor / electrical, which we are calling “core” and then the other technology centers in which they file, which we are calling “ancillary”. In each we compared their rejection rates with those of the US national average.
For all three, the percentage of 112 rejections received in their core areas – computer networks, communications and semiconductors / electrical – are at least as good if not better than the averages. Does it follow that these are the areas that these three specialize in and therefore they and their drafting law firms have developed proficiencies in? The biotechnology / organic technology center had relatively low filings, so the data in this area may not be conclusive. In the chemical and mechanical engineering technology centers we saw greater variety; all better than the average, but wide variations. In mechanical engineering for example, the industry average is for 48% of the Office actions to include a 112 rejection. Two of our three large filers came in at 40% and 46%, but Company B was significantly better at only 25%, despite not having a large volume in this technology center compared to their total number of Office actions. What have they put into practice in their filings that set them apart? Computer software was another category with one standout: Company A had only 18% of their Office actions with a 112 rejection, compared to a national average of 25% and their two peers at 26% and 23%.
In each case, we see the three following a similar pattern in terms of select technology centers with fewer percentages of 112 rejections, and other technology centers with higher percentages of Office actions with a 112 rejection. In each case, the three most prolific technology centers enjoy a lower rate of 112 rejections. This follows the national average. What is preventing these filers from applying their best practices in their core technology centers to other technology centers? What drives the differences in national averages by technology centers? Are some areas just harder to avoid 112 rejections?
Lastly, on an overall basis, these three filers see a dramatically lower incidence of 112 rejections among their Office actions. Compared to a national average of 37%, the three companies received 18%, 18% and 24% respectively. Clearly there is some focus and competence on behalf of the companies and their law firms.
Next month we plan to look at three more filers – those most active in the biochemical / organic and chemical technology sectors. Will we see similar variations?
Request Custom Analytics
If you would like to receive data on applications filed by your firm or your company like the below, to help you understand the power of analytical data to help you, please contact us and we will be happy to analyze your applications as a courtesy.
Sources: USPTO, Rowan analysis
Book a No-Obligation Discovery Call
Rowan Patents is the only platform designed specifically for the drafting and prosecution of patent applications. We’d be happy to answer any questions and provide more resources or information—with no obligation.

