Rowan Analytics Insights
Patent Prosecution Analytics Benchmarking Report – November 2022
Office Action Comparisons
For the last 18 months, Rowan has been investigating various statistics related to patent prosecution. Looking predominantly at 112 rejections, we’ve examined results by entity size, industry, top filers, law firms and corporations.
This month, we thought it would be interesting to look at the prosecution history of a random sample of patent applications and compare that to applications drafted using our integrated drafting environment, Rowan Patents. By way of full disclosure, much of the usage of Rowan Patents has been in the last few years, so many of those applications have yet to be published. As a result, the sample size of patents that were drafted in Rowan Patents is relatively small compared to the random sample. We don’t intend to draw any definitive conclusions based on these results. Rather, we want to see if the data is trending in a direction that would support the hypothesis that using patent drafting software not only provides significant efficiencies but also can impact the quality of the resulting patents.
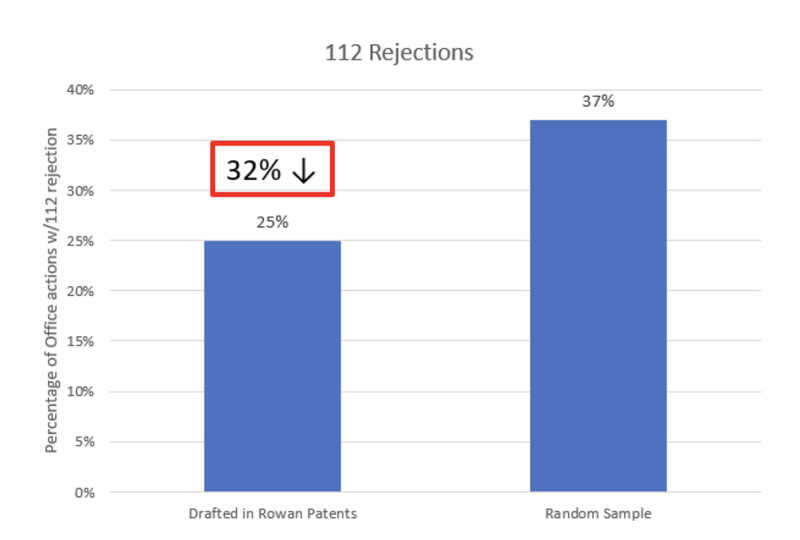
We started with investigating the percentage of applications that received a 112 rejection in their Office action, as these may be avoided with software that ensures consistency and reduces the chance of errors being introduced during the process of conveying complex information in both language and figures.
In the random sample, 37% of the Office actions contained at least one 112 rejection. In the set drafted using Rowan Patents, that dropped to 25%, a 32% decrease. Could we reduce the odds of all applications receiving a 112 rejection by 32% if every application was drafted using Rowan Patents? It is too early to tell for sure…but we will continue to monitor and report.
We also looked at the percentage of Office actions that contained only a 112 rejection. This statistic seems especially interesting to us, as without that error, the entire Office action would have been avoided, saving time and expense. Again we found the set of patents that had been drafted in Rowan Patents to have performed better than the random sample. 5% of the random sample received only a 112 rejection, vs 1% of the patents drafted using Rowan Patents. This is an improvement of 80%.
If this reduction was applied across all applications, it could reduce the overall number of Office actions by about 25,000 per year.
As we considered fewer Office actions, we also decided to look at the average number of Office actions received per application. Disposed applications in the random sample received an average of 1.11 Office actions, while those drafted using Rowan Patents received an average of .97 Office actions, representing a 13% decrease.
We appreciate that many factors can influence the number of Office actions a patent application receives – the maturity and the density of the technology space, and the intended offensive or defensive use of the patent as broad examples.
The usage of patent drafting software is still in its infancy, but these results demonstrate a possibly interesting trend of reduced Office actions, especially with potentially preventable 112 rejections. As more patents drafted in the Rowan Patents solution are published, will we continue to see such dramatic improvements? We hope so. Our clients certainly tell us we will, as they consistently report fewer errors which can lead to costly delays.
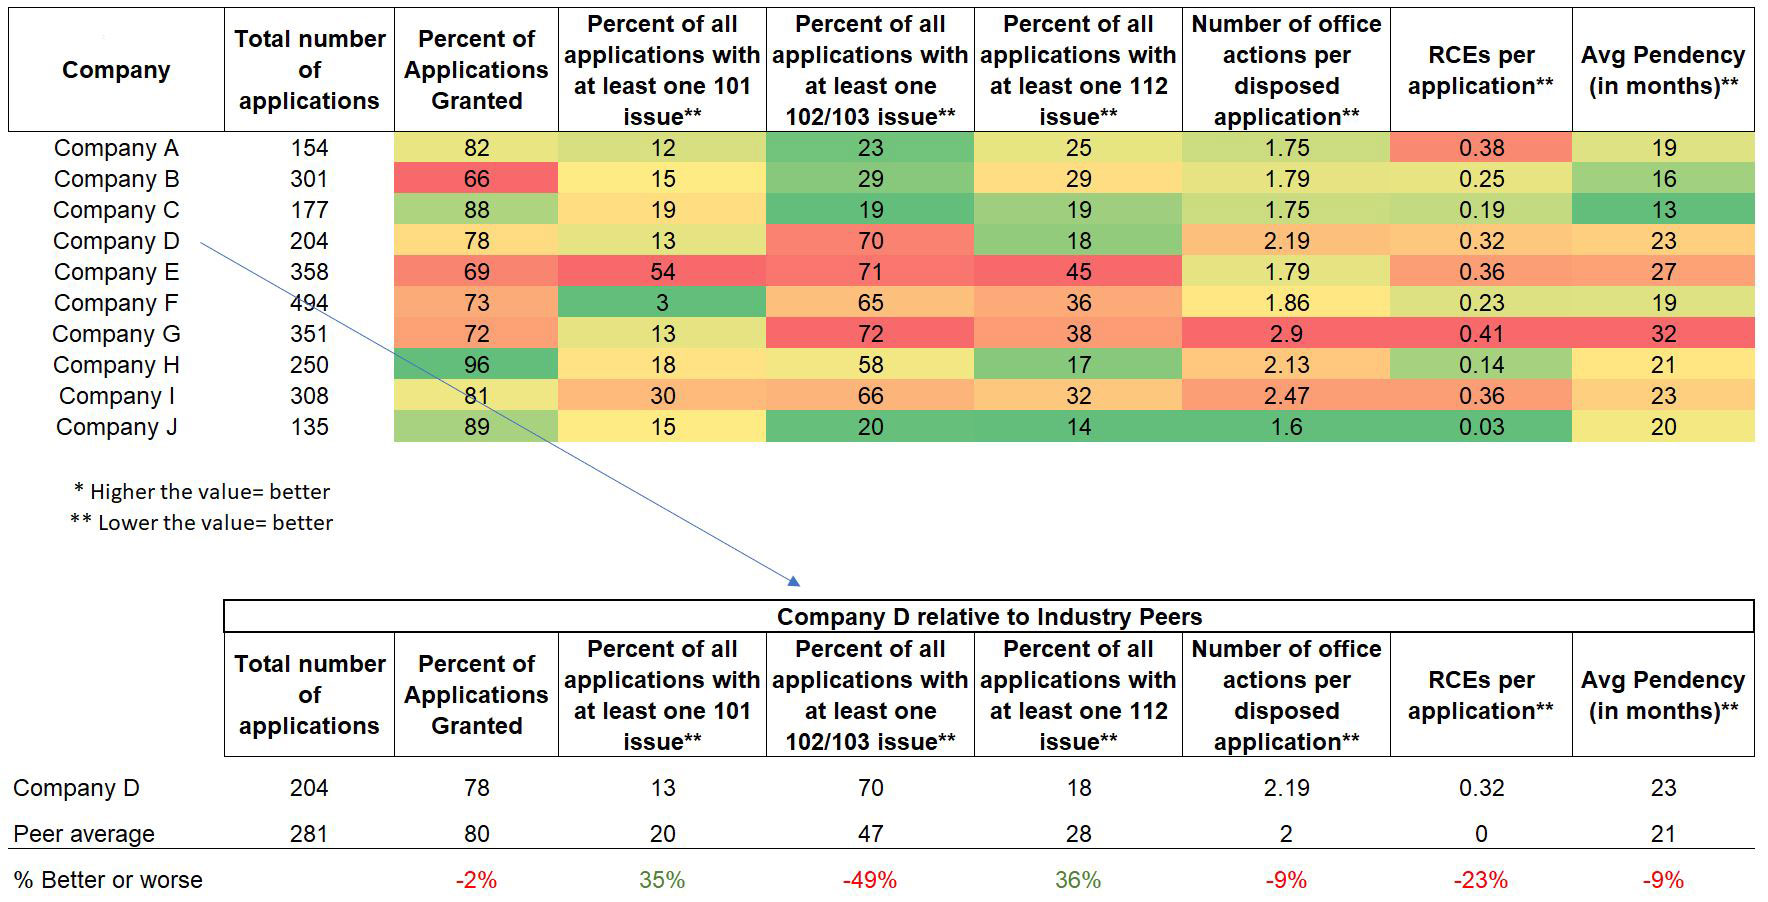
Request Custom Analytics
If you would like to receive data on applications filed by your firm or your company like the below, to help you understand the power of analytical data to help you, please contact us and we will be happy to analyze your applications as a courtesy.
Sources: USPTO, Rowan analysis
Book a No-Obligation Discovery Call
Rowan Patents is the only platform designed specifically for the drafting and prosecution of patent applications. We’d be happy to answer any questions and provide more resources or information—with no obligation.


