Rowan Analytics Insights
Patent Prosecution Analytics Benchmarking Report – July 2023
Changes in Technology Centers 2600 and 2800 Between 2011 and 2021
This month we finish our series studying the spread of granted patents by Technology Center. We continue comparing two sets of data – patents granted in 2011 and patents granted in 2021 to see which “Groups” that the USPTO lists on their website became more “popular” – receiving a larger share of granted patents, and which declined. Our analysis this month investigates two final Technology Centers: 2600 Communications, and 2800 Semiconductors, Electrical and Optical Systems, and Components.
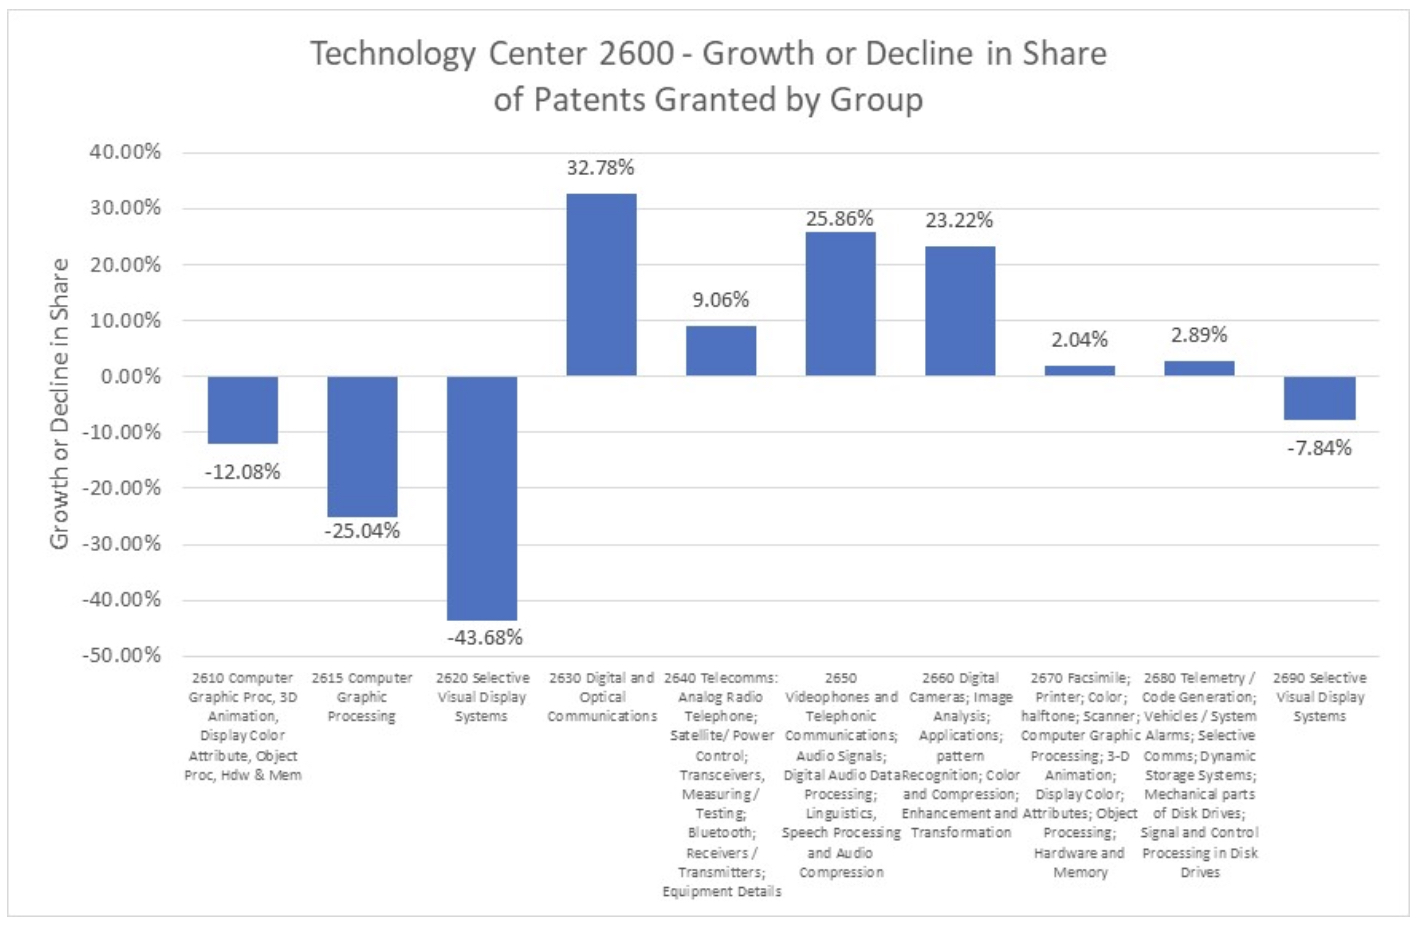
In Technology Center 2600, we saw significant gains in three Groups – 2630 Digital and Optical Communications, which grew almost 33%, 2650 Videophones and Telephonic Communications; Audio Signals; Digital Audio Data Processing; Linguistics, Speech Processing and Audio Compression, which grew almost 26%, and 2660 Digital Cameras; Image Analysis; Applications; Pattern Recognition; Color and Compression; Enhancement and Transformation, which grew over 23%. A less significant gain of just over 9% was realized by Group 2640 Telecommunications: Analog Radio Telephone; Satellite and Power Control; Transceivers, Measuring and Testing; Bluetooth; Receivers and Transmitters; Equipment Details.
The smallest gains of just over 2% and almost 3% respectively were in Group 2670 Facsimile; Printer; Color; Halftone; Scanner; Computer Graphic Processing; 3-D Animation; Display Color; Attributes; Object Processing; Hardware and Memory and Group 2680 Telemetry / Code Generation; Vehicles / System Alarms; Selective Comms; Dynamic Storage Systems; Mechanical parts of Disk Drives; Signal and Control Processing in Disk Drives.
Among those Groups that saw a decline from 2011 to 2021, the largest was experienced by Group 2620 Selective Visual Display Systems at almost 44%. The next decline, just over 25%, was experienced by Group 2615 Computer Graphic Processing. Next was a decline of just over 12% experienced by Group 2610 Computer Graphic Processing, 3D Animation, Display Color Attribute, Object Proc, Hardware & Memory. The smallest decline of almost 8% was experienced by Group 2690 Selective Visual Display Systems.
As we moved into Technology Center 2800 there are a smaller number of Groups, with none experiencing gains or declines as large as we have seen in some of the other Technology Centers.
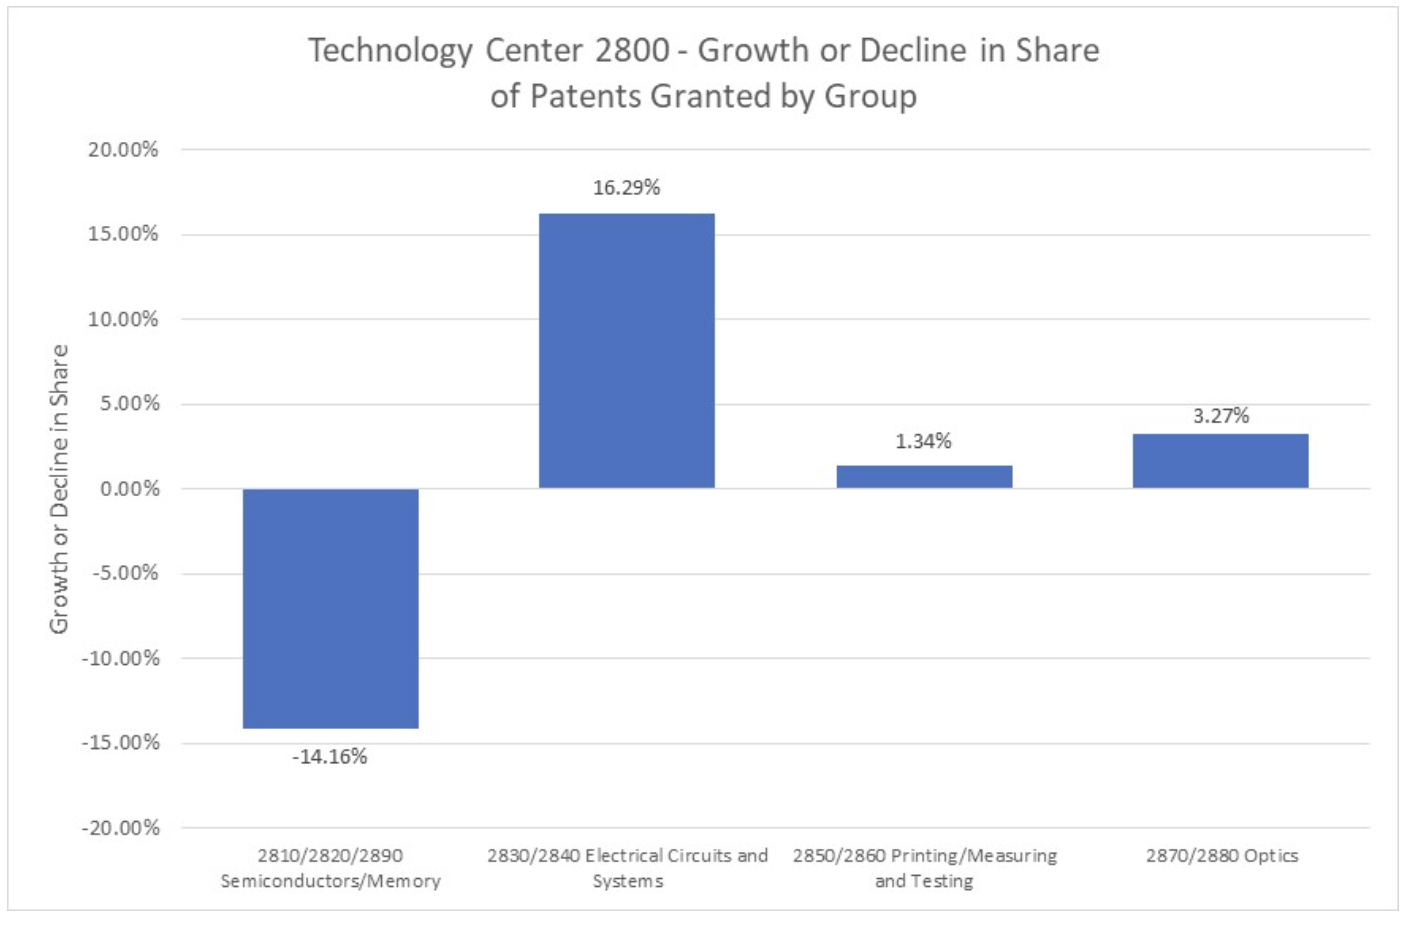
The biggest gain, over 16%, came in Group 2830/2840 Electrical Circuits and Systems. Two other Groups within the 2800 Technology Center saw small increases. Group 2870/2880 Optics experienced a gain of more than 3%. And Group 2850/2860 Printing/Measuring and Testing saw a gain of over 1%.
There was one decline in the center. Group 2810/2820/2890 Semiconductors/Memory declined over 14%.
We hope you have found the data on gains and declines over the last few months to be interesting. Next month we’ll start a series on 101/102/103 errors by Technology Center. We are looking forward to what that data shows!
Request Custom Analytics
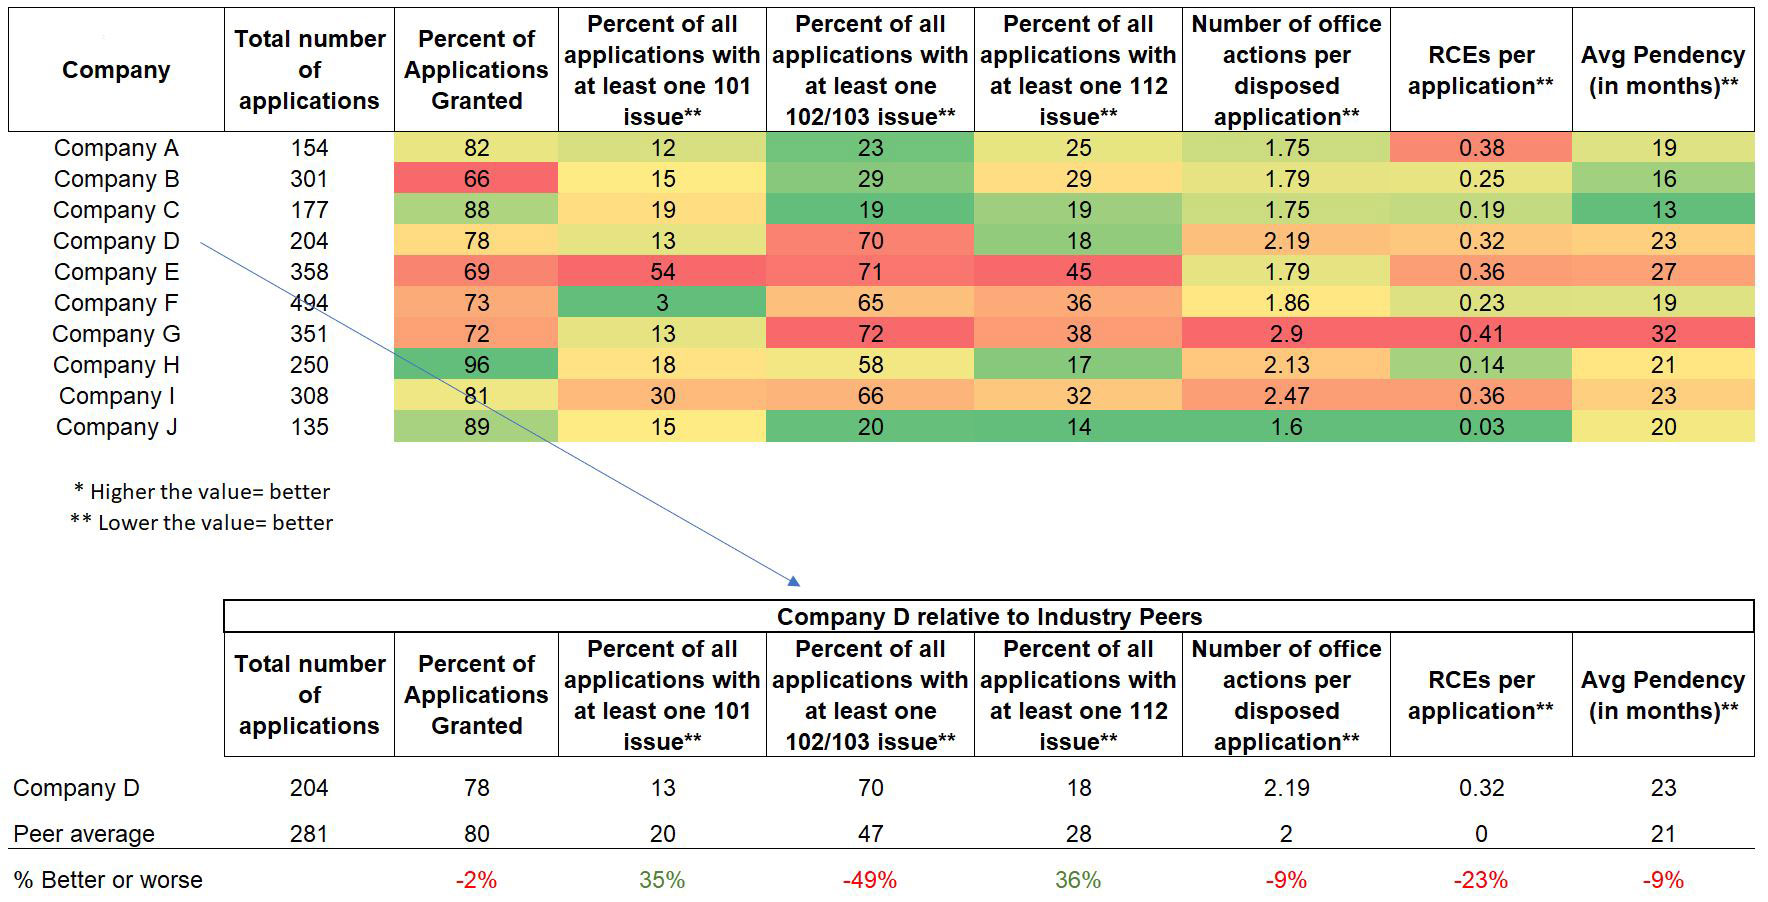
If you would like to receive data on applications filed by your firm or your company like the below, to help you understand the power of analytical data to help you, please contact us and we will be happy to analyze your applications as a courtesy.
Book a No-Obligation Discovery Call
Rowan Patents is the only platform designed specifically for the drafting and prosecution of patent applications. We’d be happy to answer any questions and provide more resources or information—with no obligation.


