

Rowan Analytics Insights
Patent Prosecution Analytics Benchmarking Report – February 2022
Rejection Rates for Top Filing Law Firms in High Tech Sectors
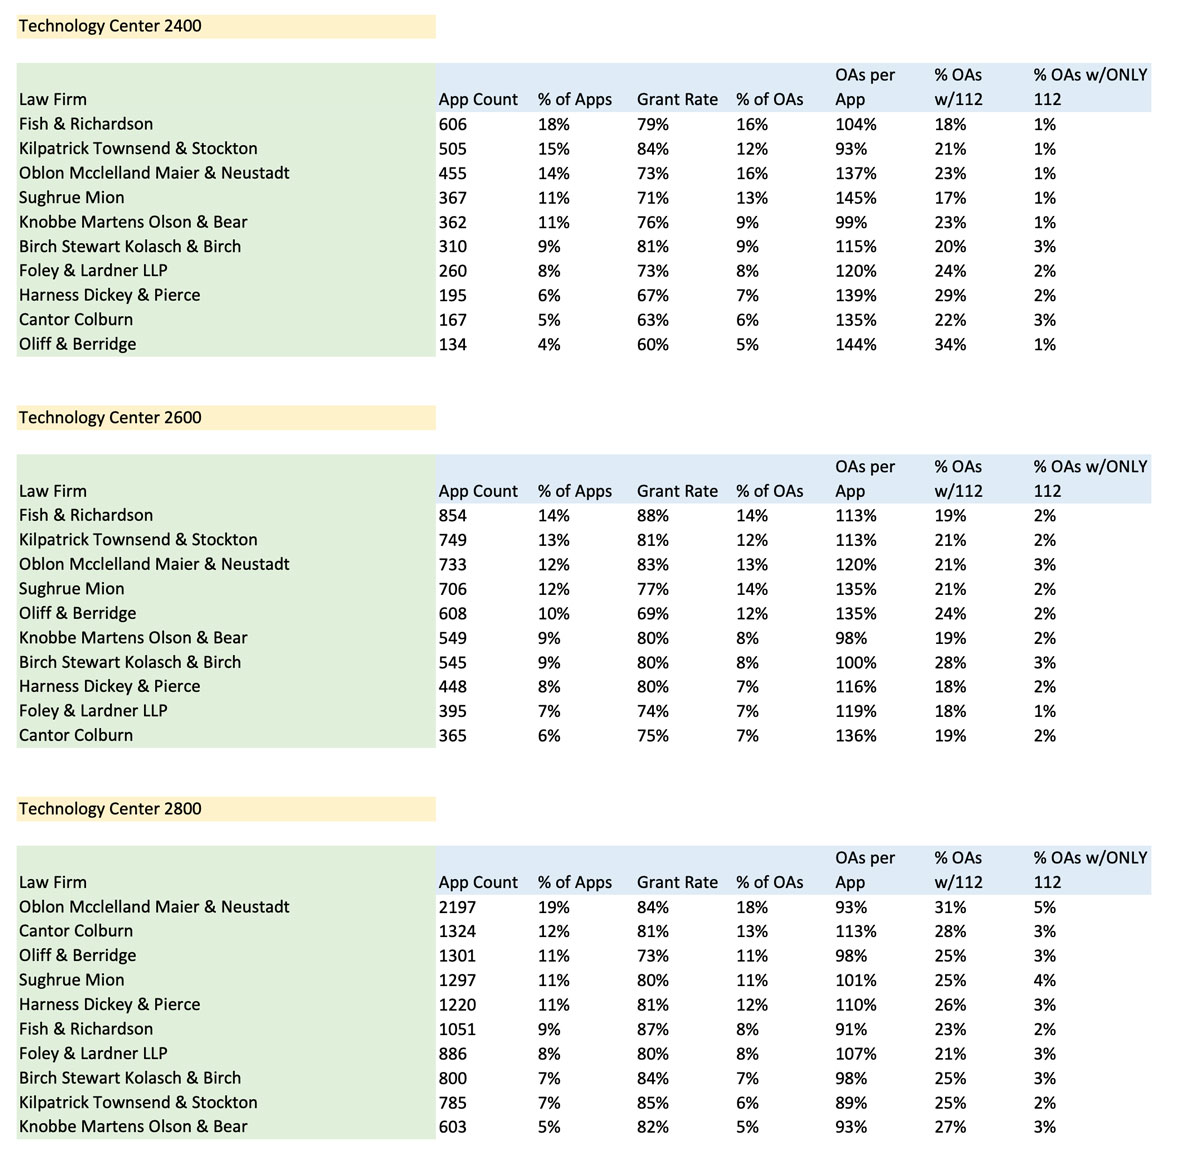
This month, Rowan digs into the top filing firms by issued patents at the USPTO in three Technology Centers frequented by the high tech consumer electronics industry – computer networks (2400), communications (2600) and semiconductor / electrical (2800). We identify the top firms in terms of volumes of issued patents and examine their 112 rejection rates compared to national averages.
For computer networks – Tech Center 2400, the top filing firm is Fish & Richardson, with 606 applications in 2020. Following them is Kilpatrick Townsend & Stockton at 505, and Oblon, McClelland, Maier & Neustadt with 455 applications. How did these three compare with the national average in terms of 112 rejections?

In this grouping, we see both lower and higher than the national average. Fish & Richardson, with the highest volume, did the best, slightly better than the national average.
As we move to the 2600 Tech Center, communications, the top firms are the same – Fish & Richardson with 854 applications, Kilpatrick Townsend with 749 applications and Oblon, McClelland, Maier & Neustadt with 455 applications. In comparison to the national average, we see a similar result to the 2400 Tech Center, with Fish & Richardson slightly beating the average, and the other two slightly above.

Moving into the 2800 Tech Center, semiconductors, the firms change, the volumes are higher, and the percentage of 112 rejections are also higher than the previous tech centers. The top filing firm is Oblon, McClelland, Maier & Neustadt with 2197 applications. Cantor Colburn is next with 1324 applications, followed by Oliff at 1301.

In contrast to 2400 & 2600, the law firm with the highest volume – Oblon – actually has a higher 112 rejection percentage than the national average, while Cantor Colburn slightly beat the average and Oliff was 4 points better.
As with previous data, we find the 112 rejection percentages vary, and the highest volumes, whether by filing company or filing firm, do not always lead to the lowest 112 rejection percentages. However, this data does show one element that is consistent with our prior analysis of corporations – some firms are consistently better than others when it comes to rates of 112 rejections. Is this due to their deployment of technology to assist in error prevention? Or do they utilize different internal workflows that place an increased emphasis on catching these issues prior to filing?
Note: Harrity Patent Analytics has released their top legal firms of 2021, with several changes in position. In order to remain consistent with our past analysis, we have used their top legal firms of 2020 for this article. In a future edition we will examine differences between 2020 and 2021.
Request Custom Analytics
If you would like to receive data on applications filed by your firm or your company like the below, to help you understand the power of analytical data to help you, please contact us and we will be happy to analyze your applications as a courtesy.

Sources: USPTO, Rowan analysis
Book a No-Obligation Discovery Call
Rowan Patents is the only platform designed specifically for the drafting and prosecution of patent applications. We’d be happy to answer any questions and provide more resources or information—with no obligation.
